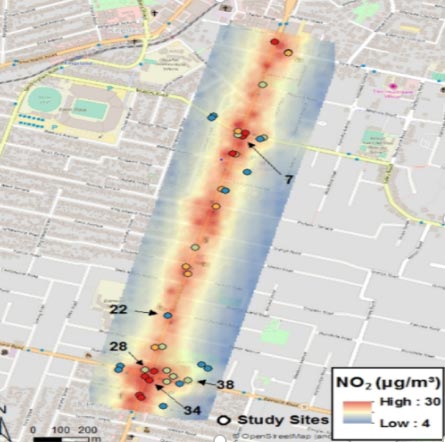
To identify the relationship between pedestrian exposure at key commercial strip locations, and spatial pollutant concentration from increased traffic congestion, accurate high-density quantification of ambient concentrations of nitrogen dioxide, ozone, and PM2.5 was required along a major urban road (in conjunction with highly targeted pedestrian and vehicle information).
Example: Urban road pollutant management and pedestrian exposure

NO2 concentrations measured at the 40 sites (represented by the dots, with numbered dots showing sites with largest discrepancies between modelled and measured NO2 concentrations) and modelled along the major urban road.
Traffic flows, and pedestrian counts were captured using Bluetooth style wireless detectors and video imagery. Nitrogen dioxide (NO2), ozone (O3) and PM2.5 data was streamed in real-time to a central server for dynamic calibration and validation processes.
The campaign confirmed that despite transient, elevated nitrogen dioxide concentrations along some road sections, the area complied within the National Standards and pedestrian exposure was acceptable under current and future traffic flows.
